WAT
Writing Analytics Tool (WAT): Designing for Data-Driven Educational Transformation
Role
Lead UX Designer
Duration
July 2023 - Present
Team
Me (UX designer), Project Manager, Software Engineers (x2), Principal Investigator
A full UX redesign and design system implementation for an NLP-based educational platform, backed by teacher focus groups and iterative prototyping.
TL;DR
I was the sole UX designer for the Writing Analytics Tool (WAT), taking it from a basic MVP built by developers to a user-friendly platform ready for beta testing.
I built a complete design system, redesigned core features like rubric creation and feedback interpretation, and conducted user research that directly influenced product strategy and contributed to academic research publications.

Challenge
Making Complex Analytics Actually Usable
The Learning Engineering Institute (LEI) had built the Writing Analytics Tool (WAT), an open-source platform that uses natural language processing (NLP) to analyze student writing for teachers and researchers.
The problem? The initial MVP, built by developers, had a clunky interface, confusing user flows, and feedback that was impossible to understand.
This created real barriers. Teachers couldn't tap into WAT's powerful analytics, and students couldn't make sense of their writing performance data.
I needed to:
-
Modernize the platform - Turn the existing MVP into something intuitive and scalable
-
Make feedback useful - Design interfaces that turned complex NLP data into actionable insights
-
Support different user needs - Work for students seeking revision help, teachers facilitating practice.
-
Address adoption concerns - Ensure teachers would actually use it despite worries about increased workload and confusing analytics
Role
As the sole UX designer, I handled end-to-end UX, including design systems, user research, and strategic input.
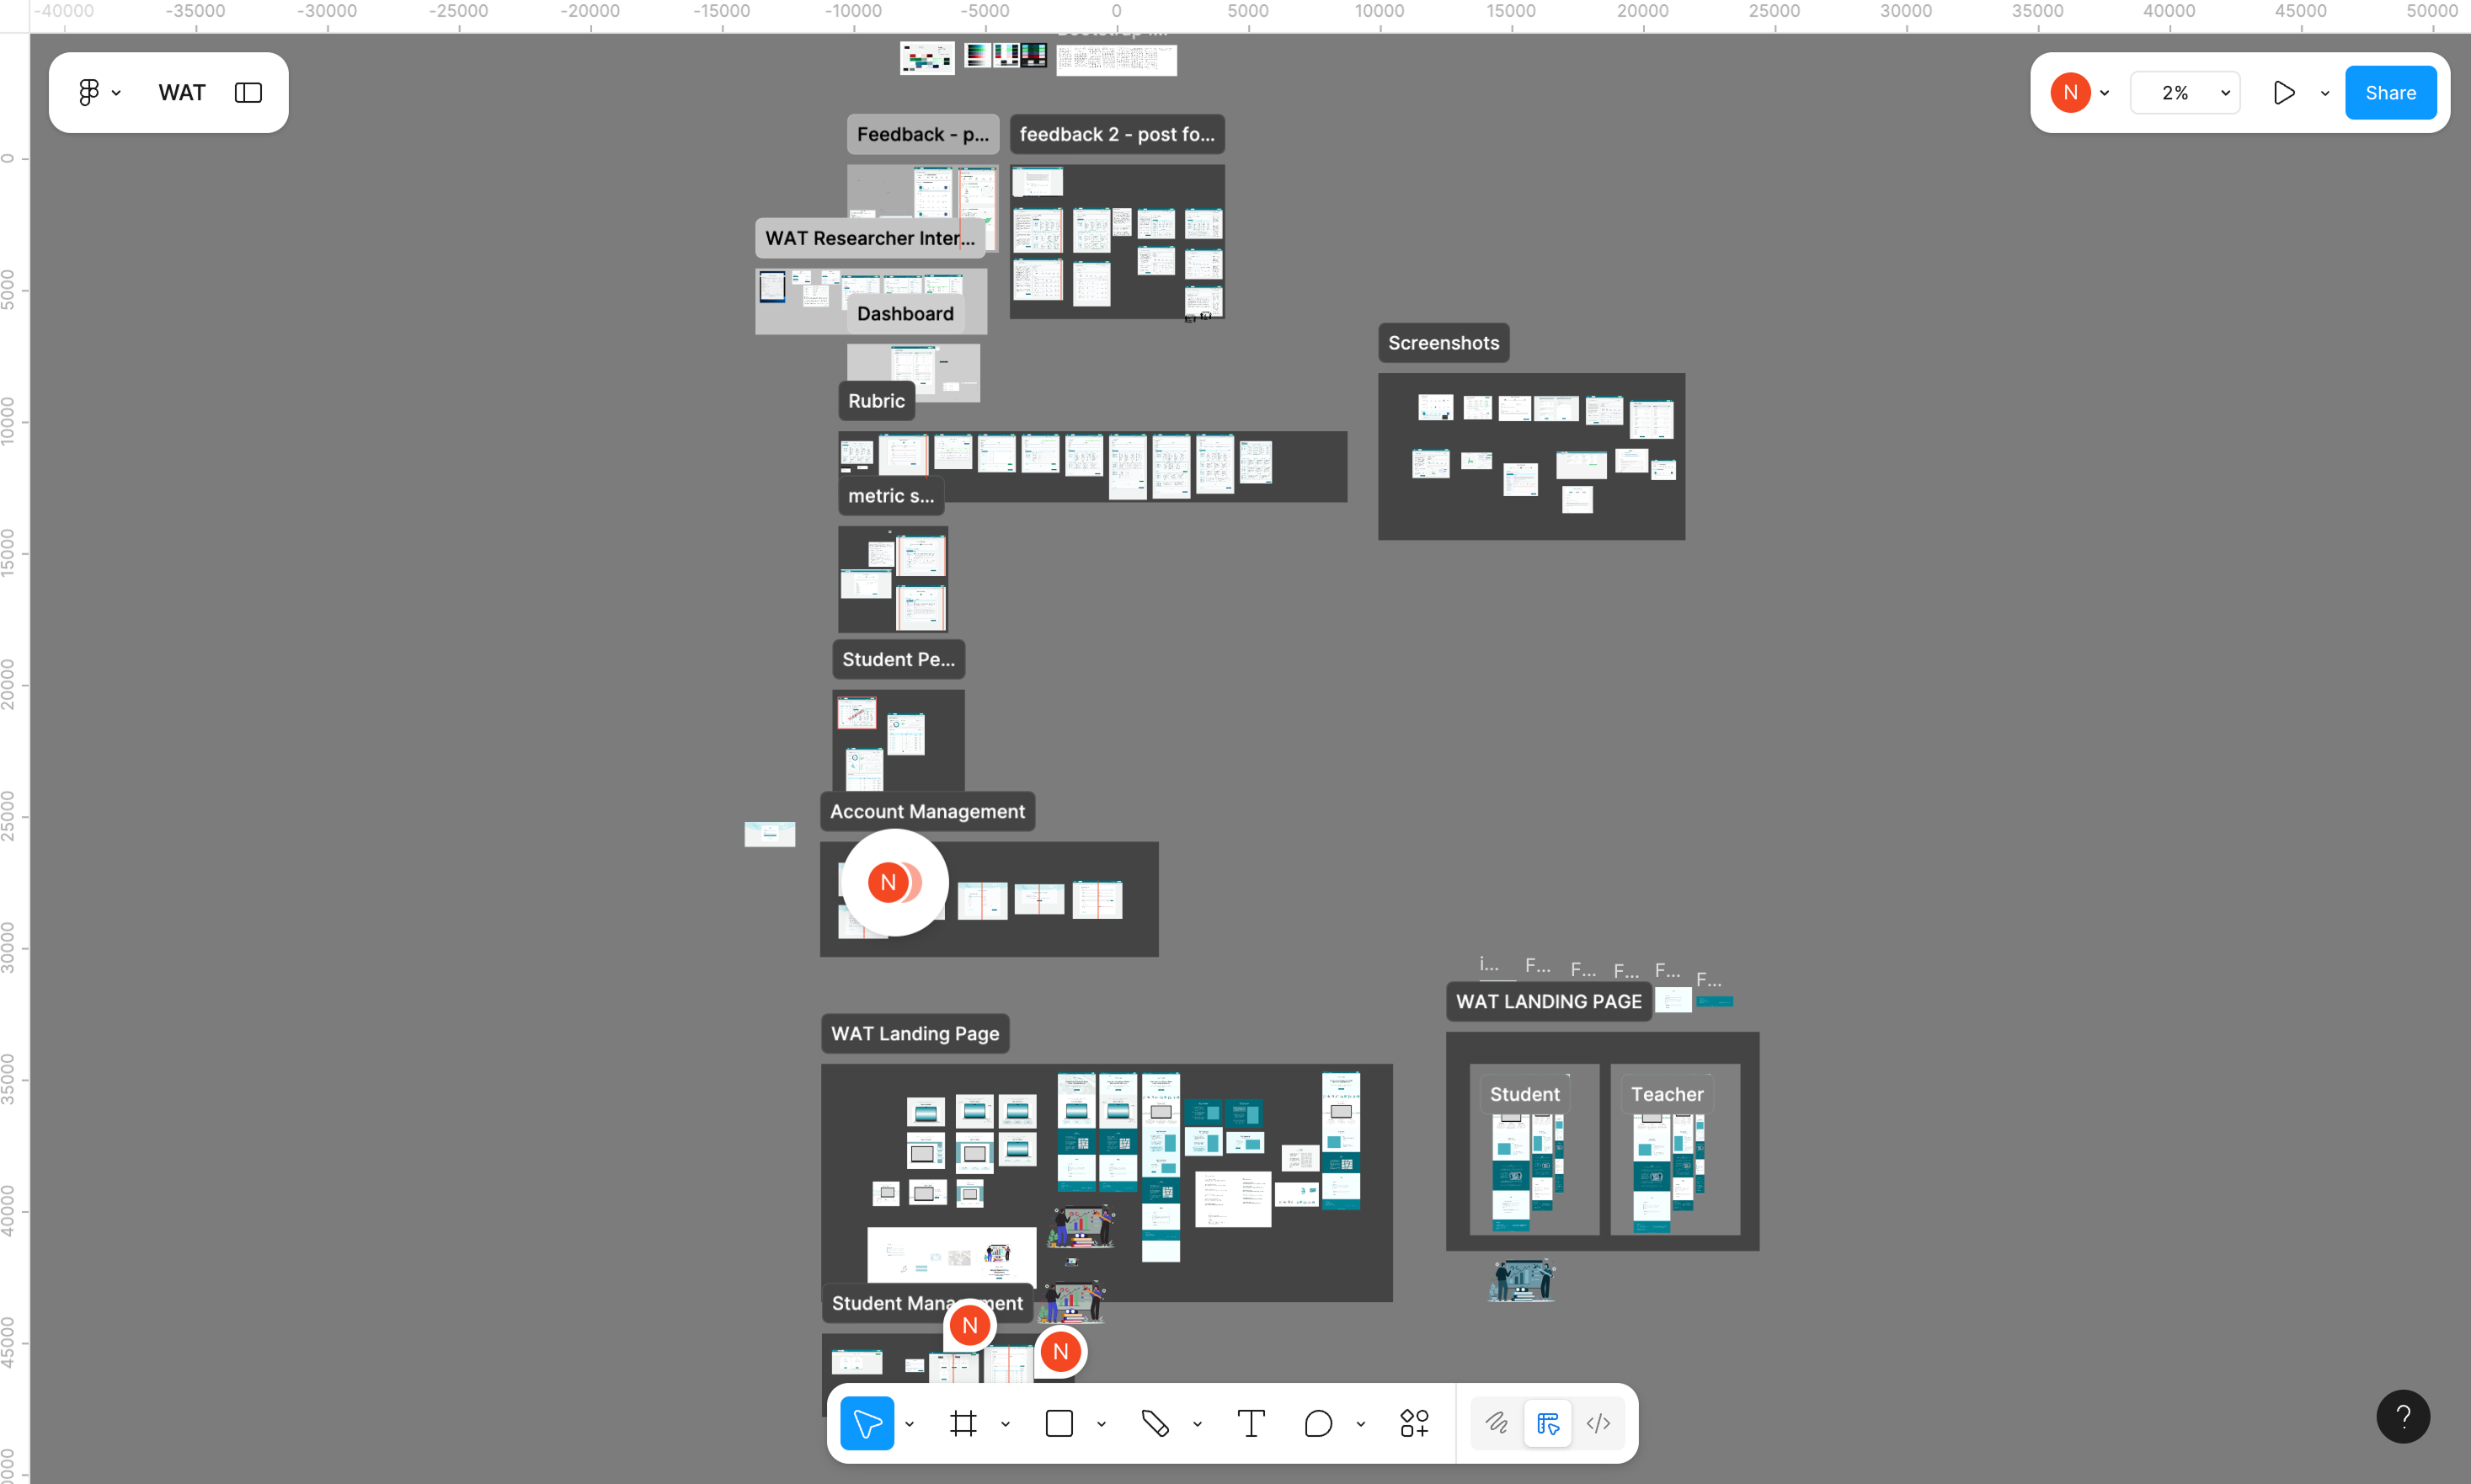
UX/UI Design Lead: Created interactive prototypes in Figma for analytics, feedback, rubrics, and student/teacher dashboards.
Design System: Developed and coded a Material Design-based system, ensuring consistency throughout the platform.
User Research: Ran usability tests, facilitated teacher focus groups, and analyzed findings with ASU's Betaland AI.
QA & Iteration: Conducted QA testing, logged 50+ improvements, and led iterative refinements.
Collaboration: Partnered with engineers, data scientists, and researchers to match designs with technical and research needs.
Strategy: Influenced product direction, user documentation, messaging, and launch strategy.
Process
User-Centered Design in Action
Foundation & Standardization (Summer/Fall 2023): I migrated existing designs from XD to Figma and developed a comprehensive design system. Then standardized UX copy and introduced mandatory notifications, tooltips, and navigation guards to prevent data loss.
Internal Validation & Early Enhancements: I conducted internal usability testing with the LEI Research team to identify initial friction points and implemented features like calendars for teachers and students based on initial requirements.
Pivotal External Research (Focus Groups - July 2024): I co-facilitated focus groups with ASU teachers that revealed critical insights:
- Metrics needed clarity - Instructors found metrics redundant or unclear
- Customization was essential - Teachers wanted to align metrics with course goals and control what students saw
- Workload was a major concern - Using WAT as a standalone tool felt like too much extra work
- Interface needed simplification - Cognitive load was too high
Strategic Redesign & Feature Development (Post-Focus Group): Based on research findings, I prioritized and redesigned:
- Rubric creation & management
- Analytics feedback interpretation
- Student performance tracking
Analysis & Academic Contribution: I contributed to qualitative data analysis and helped draft research findings for conference submissions like LAK2025 and JEDM2025.
Design System
Key Design Decisions & Solutions
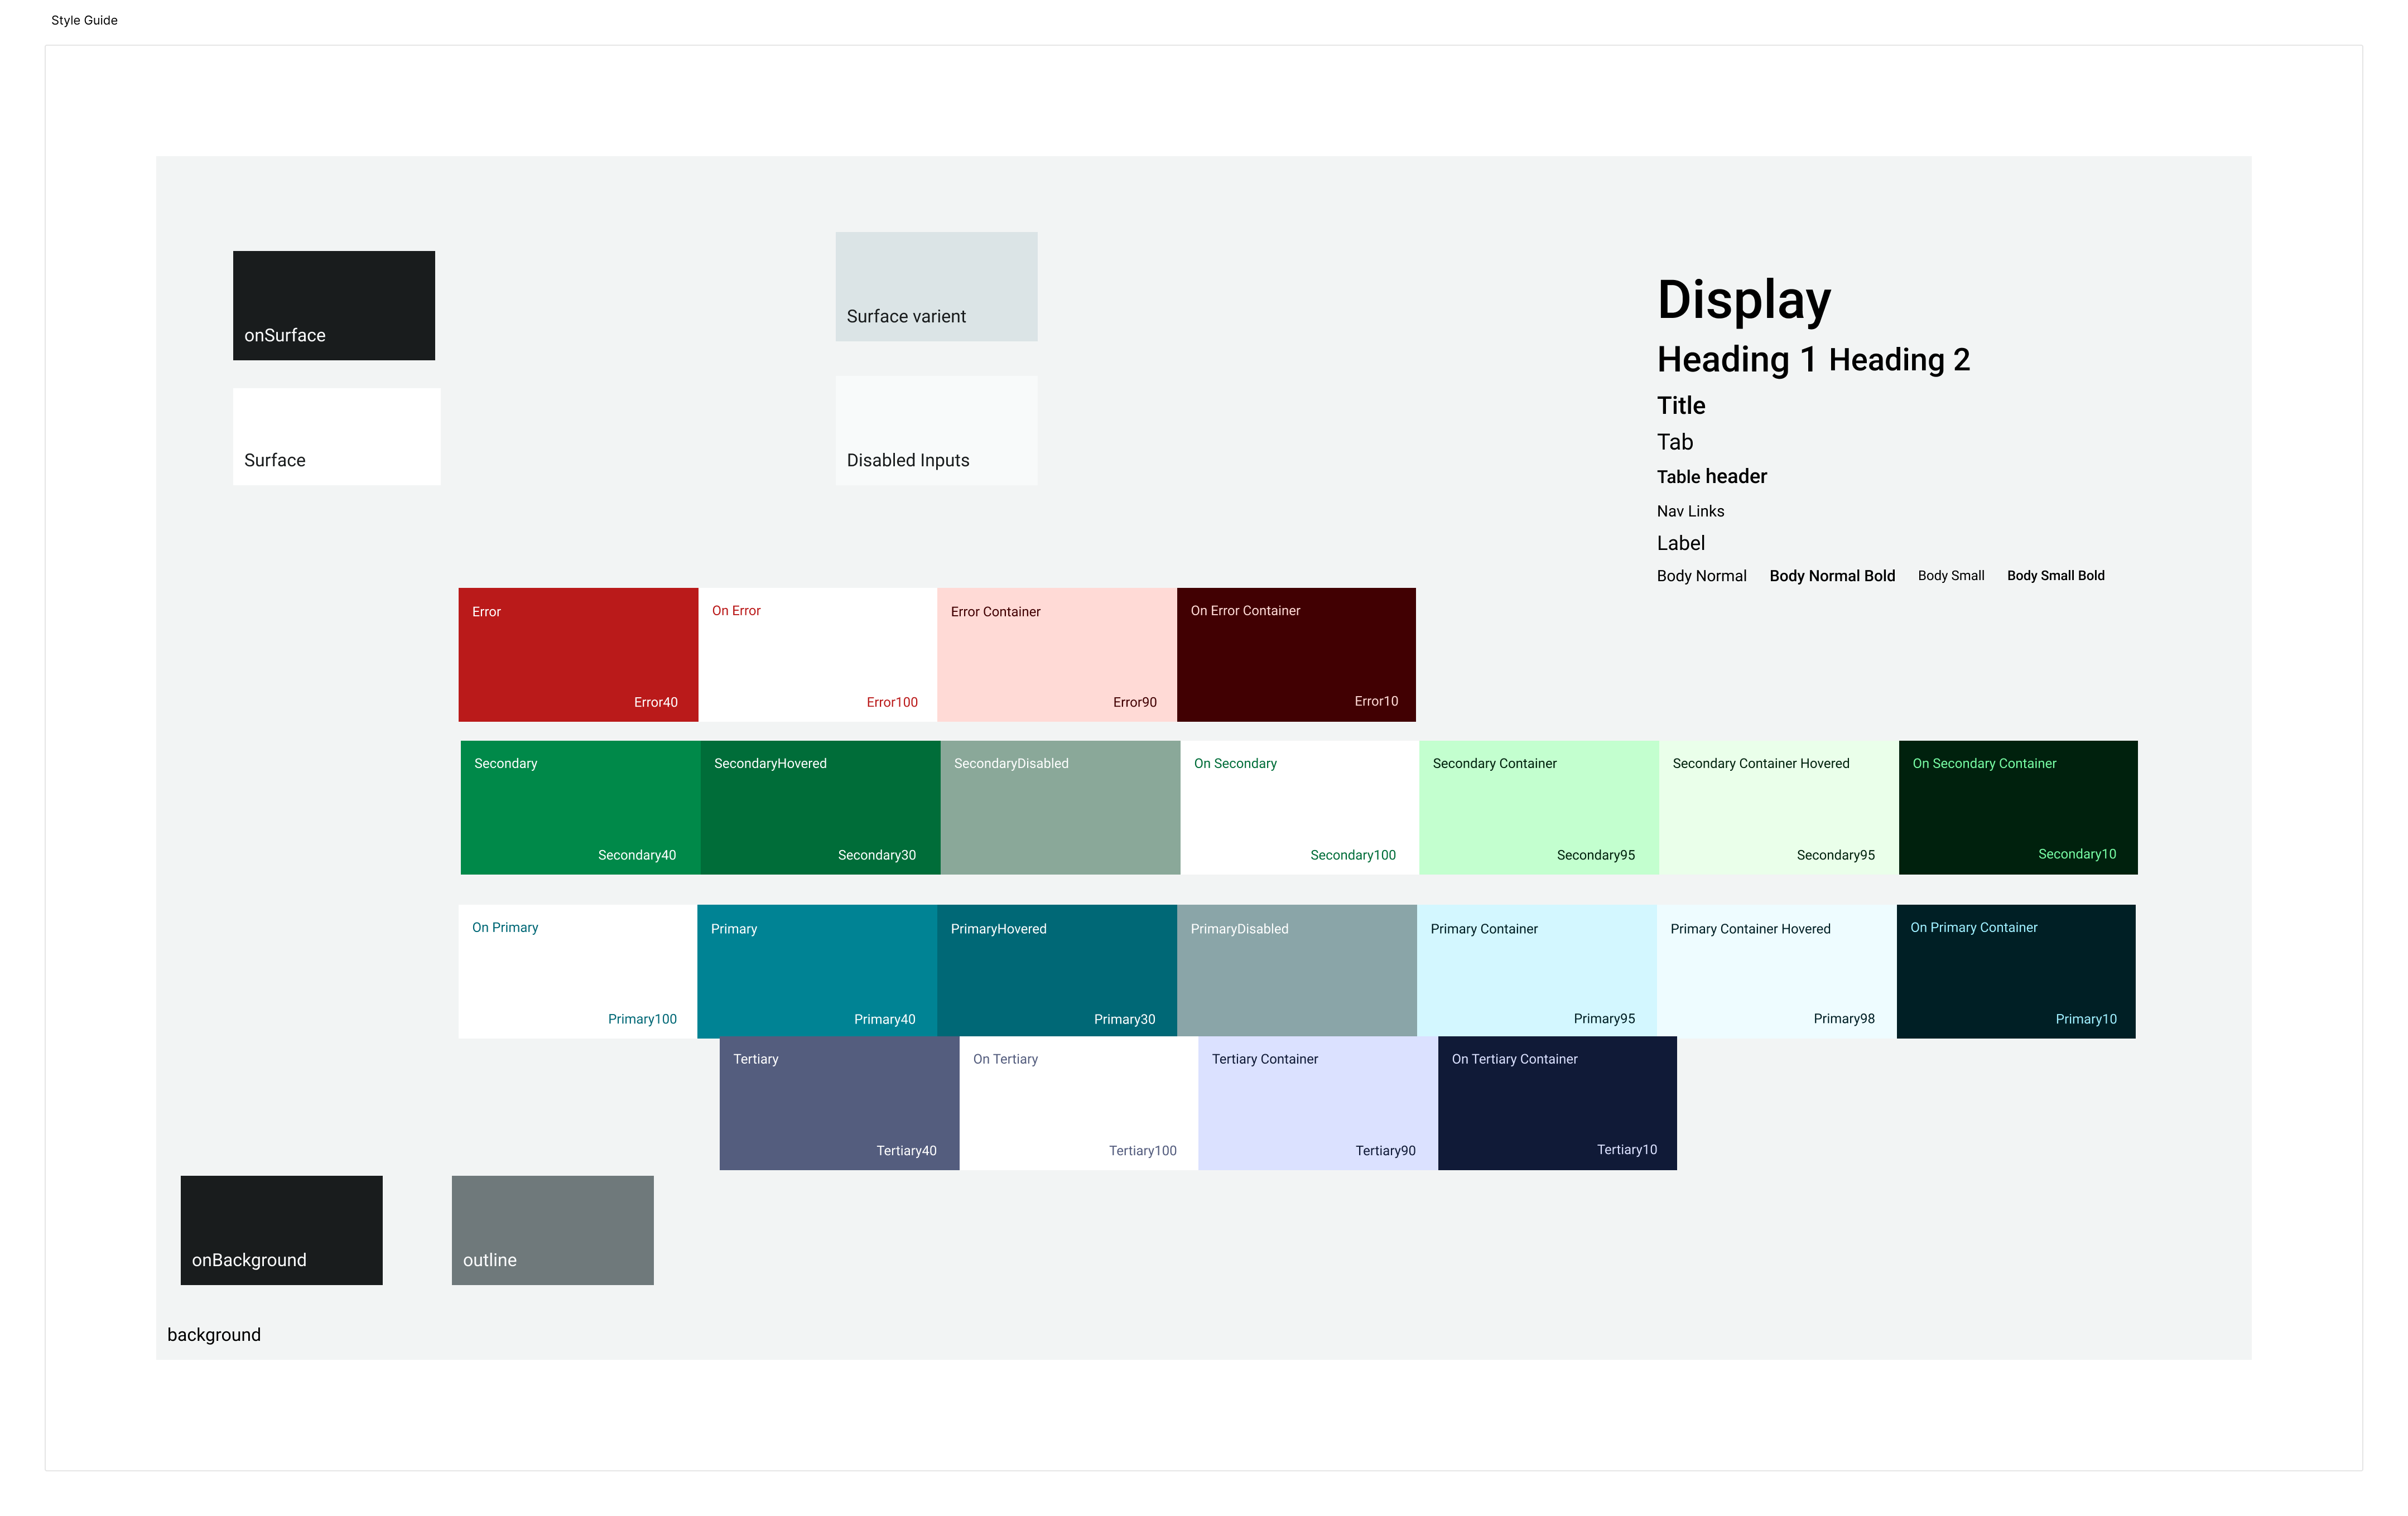
Building a Robust Design System
Decision: I prioritized creating a Material Design-based system and coded the core CSS myself.
Impact: This ensured consistency, streamlined development, gave the application a cohesive look and feel, and made future feature iteration much easier.
Rubric System
Key Design Decisions & Solutions
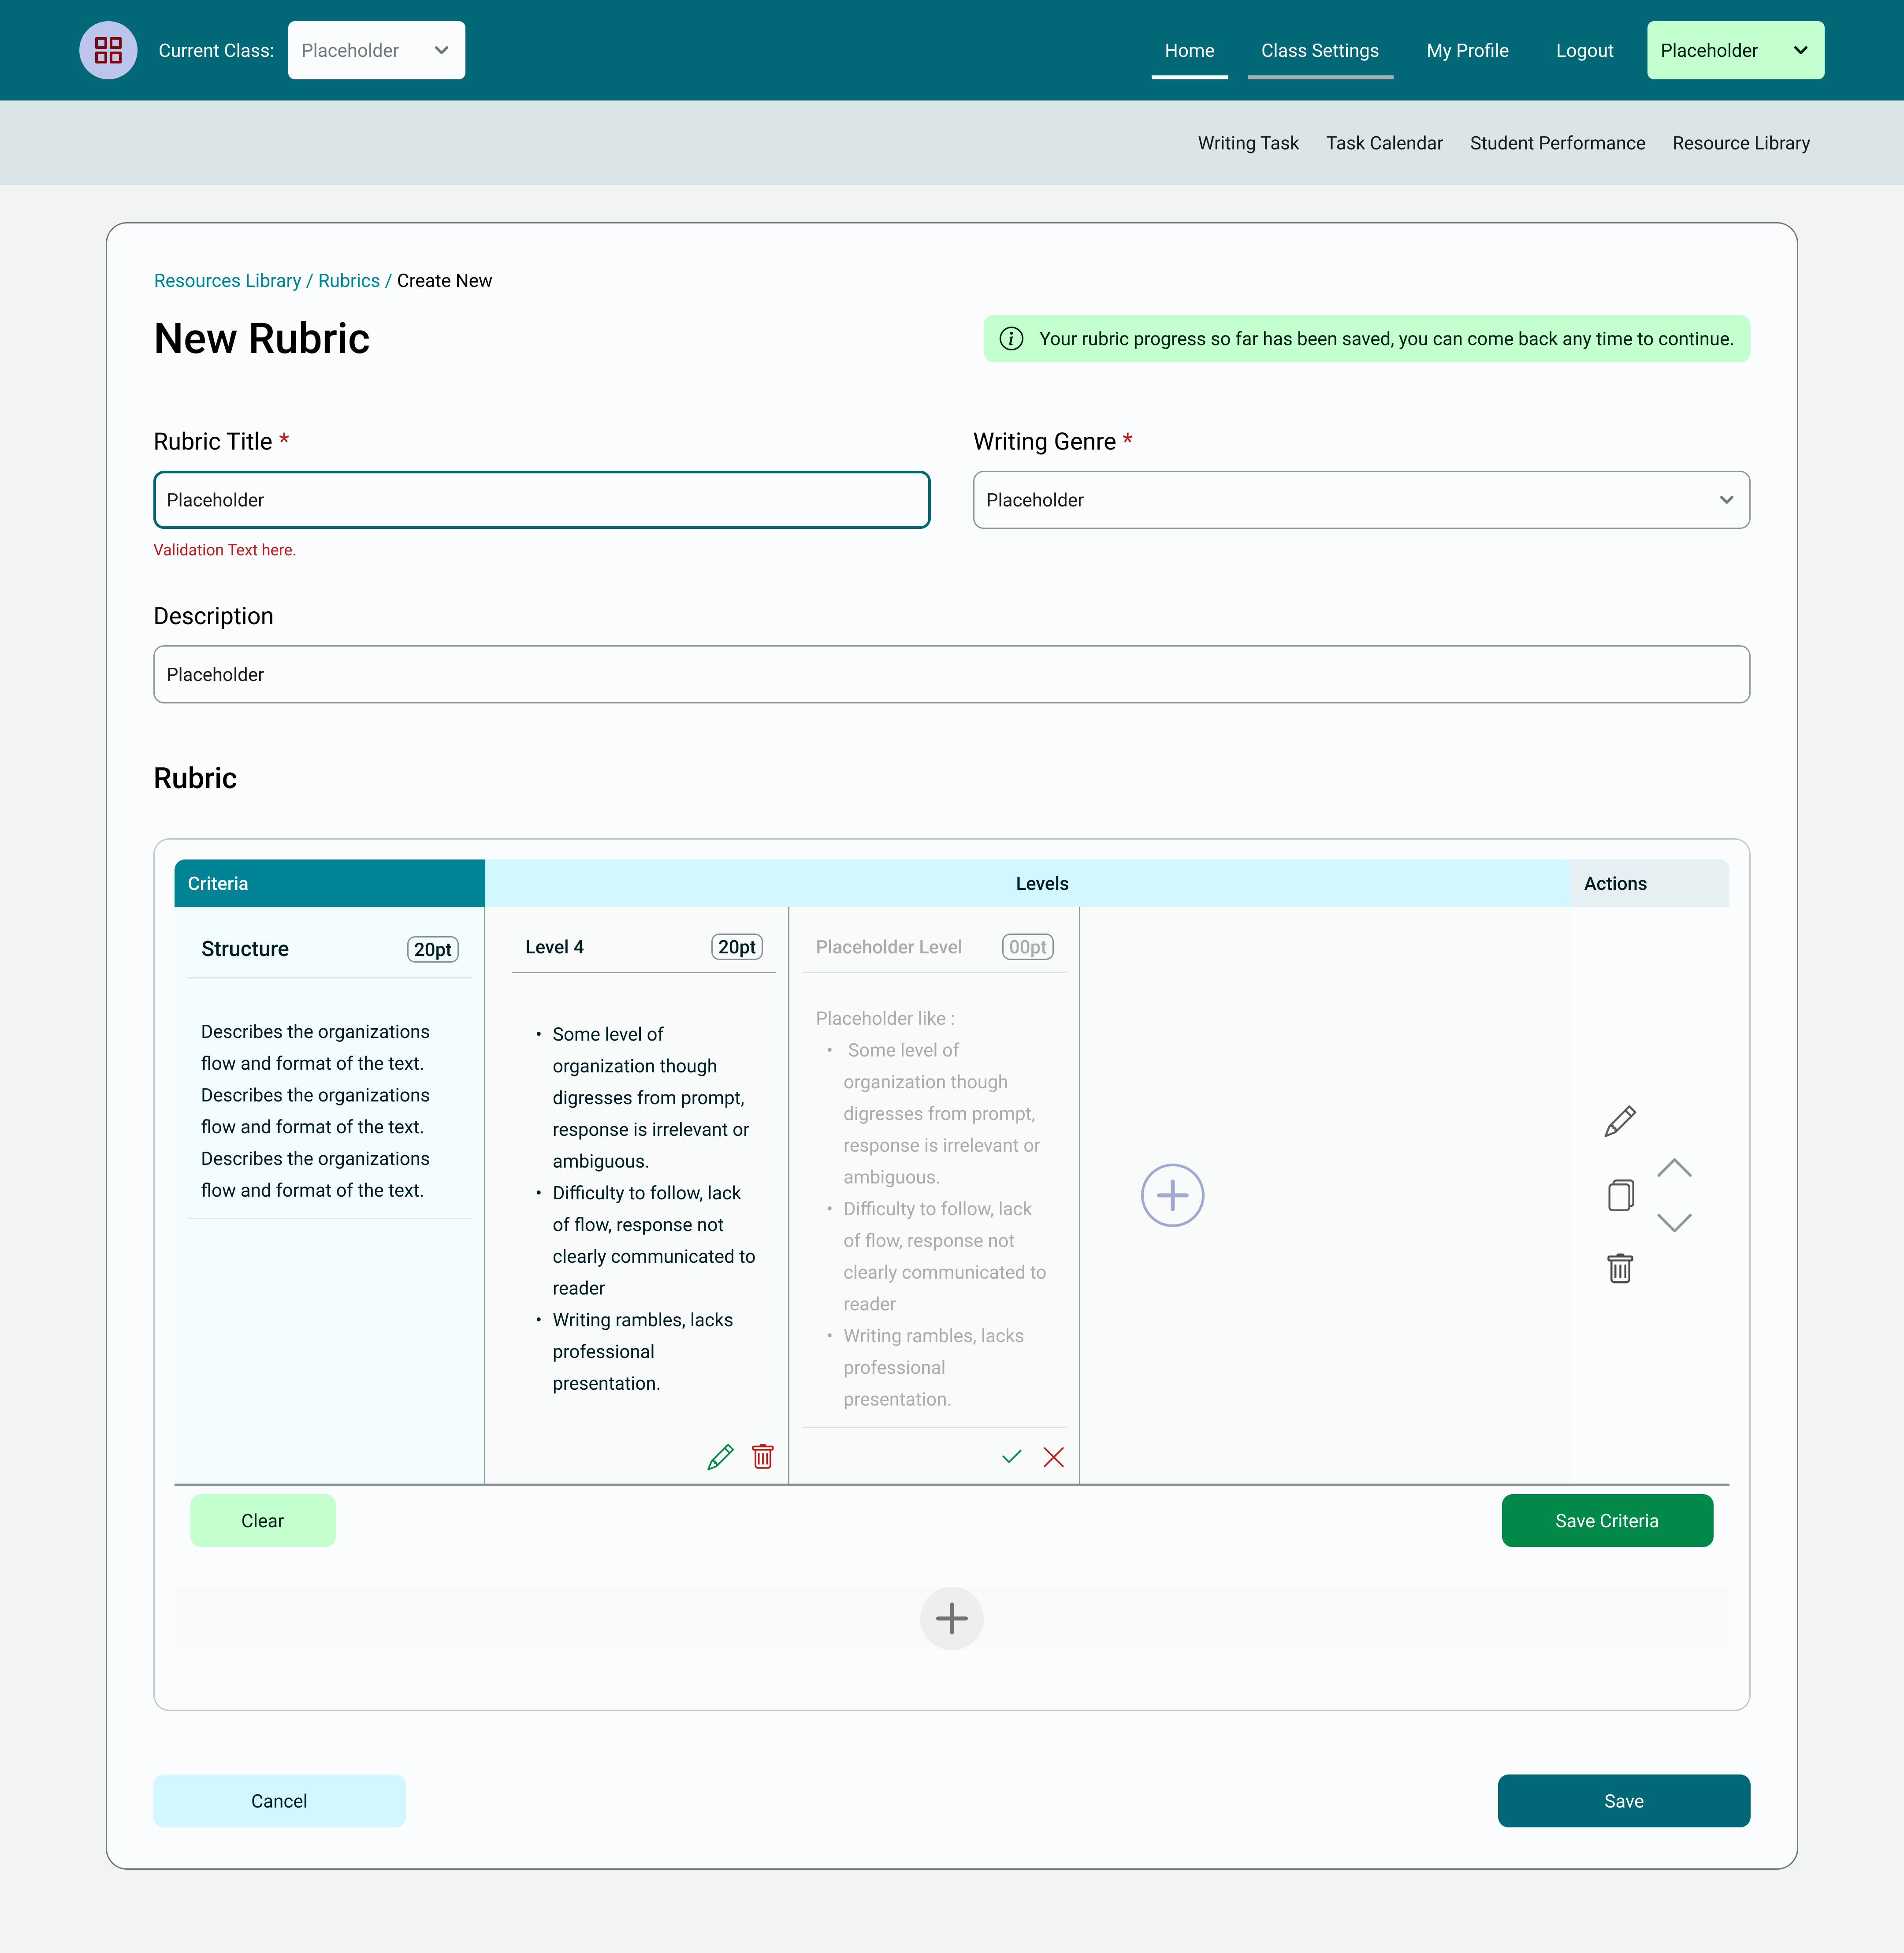
Revamping Rubric Creation & Interaction
Challenge: Teachers needed intuitive, flexible rubric tools that fit their existing workflows.
Solution: I designed a multi-flow rubric system:
- Creation: Inspired by Canvas but with enhanced iconography and WAT-specific adaptations, allowing granular criteria/level creation with duplicate/edit/delete functionality
- View Mode: Clear presentation for teachers during assignment setup and for students upon receiving assignments
- Evaluation (Comment) Mode: Teachers select levels, add comments per criterion, with auto-calculated scores
- Student Feedback View: Students see the evaluated rubric with all comments
Impact: This gave teachers powerful, familiar tools that increased their autonomy and willingness to use the rubric feature.
Feedback System
Key Design Decisions & Solutions
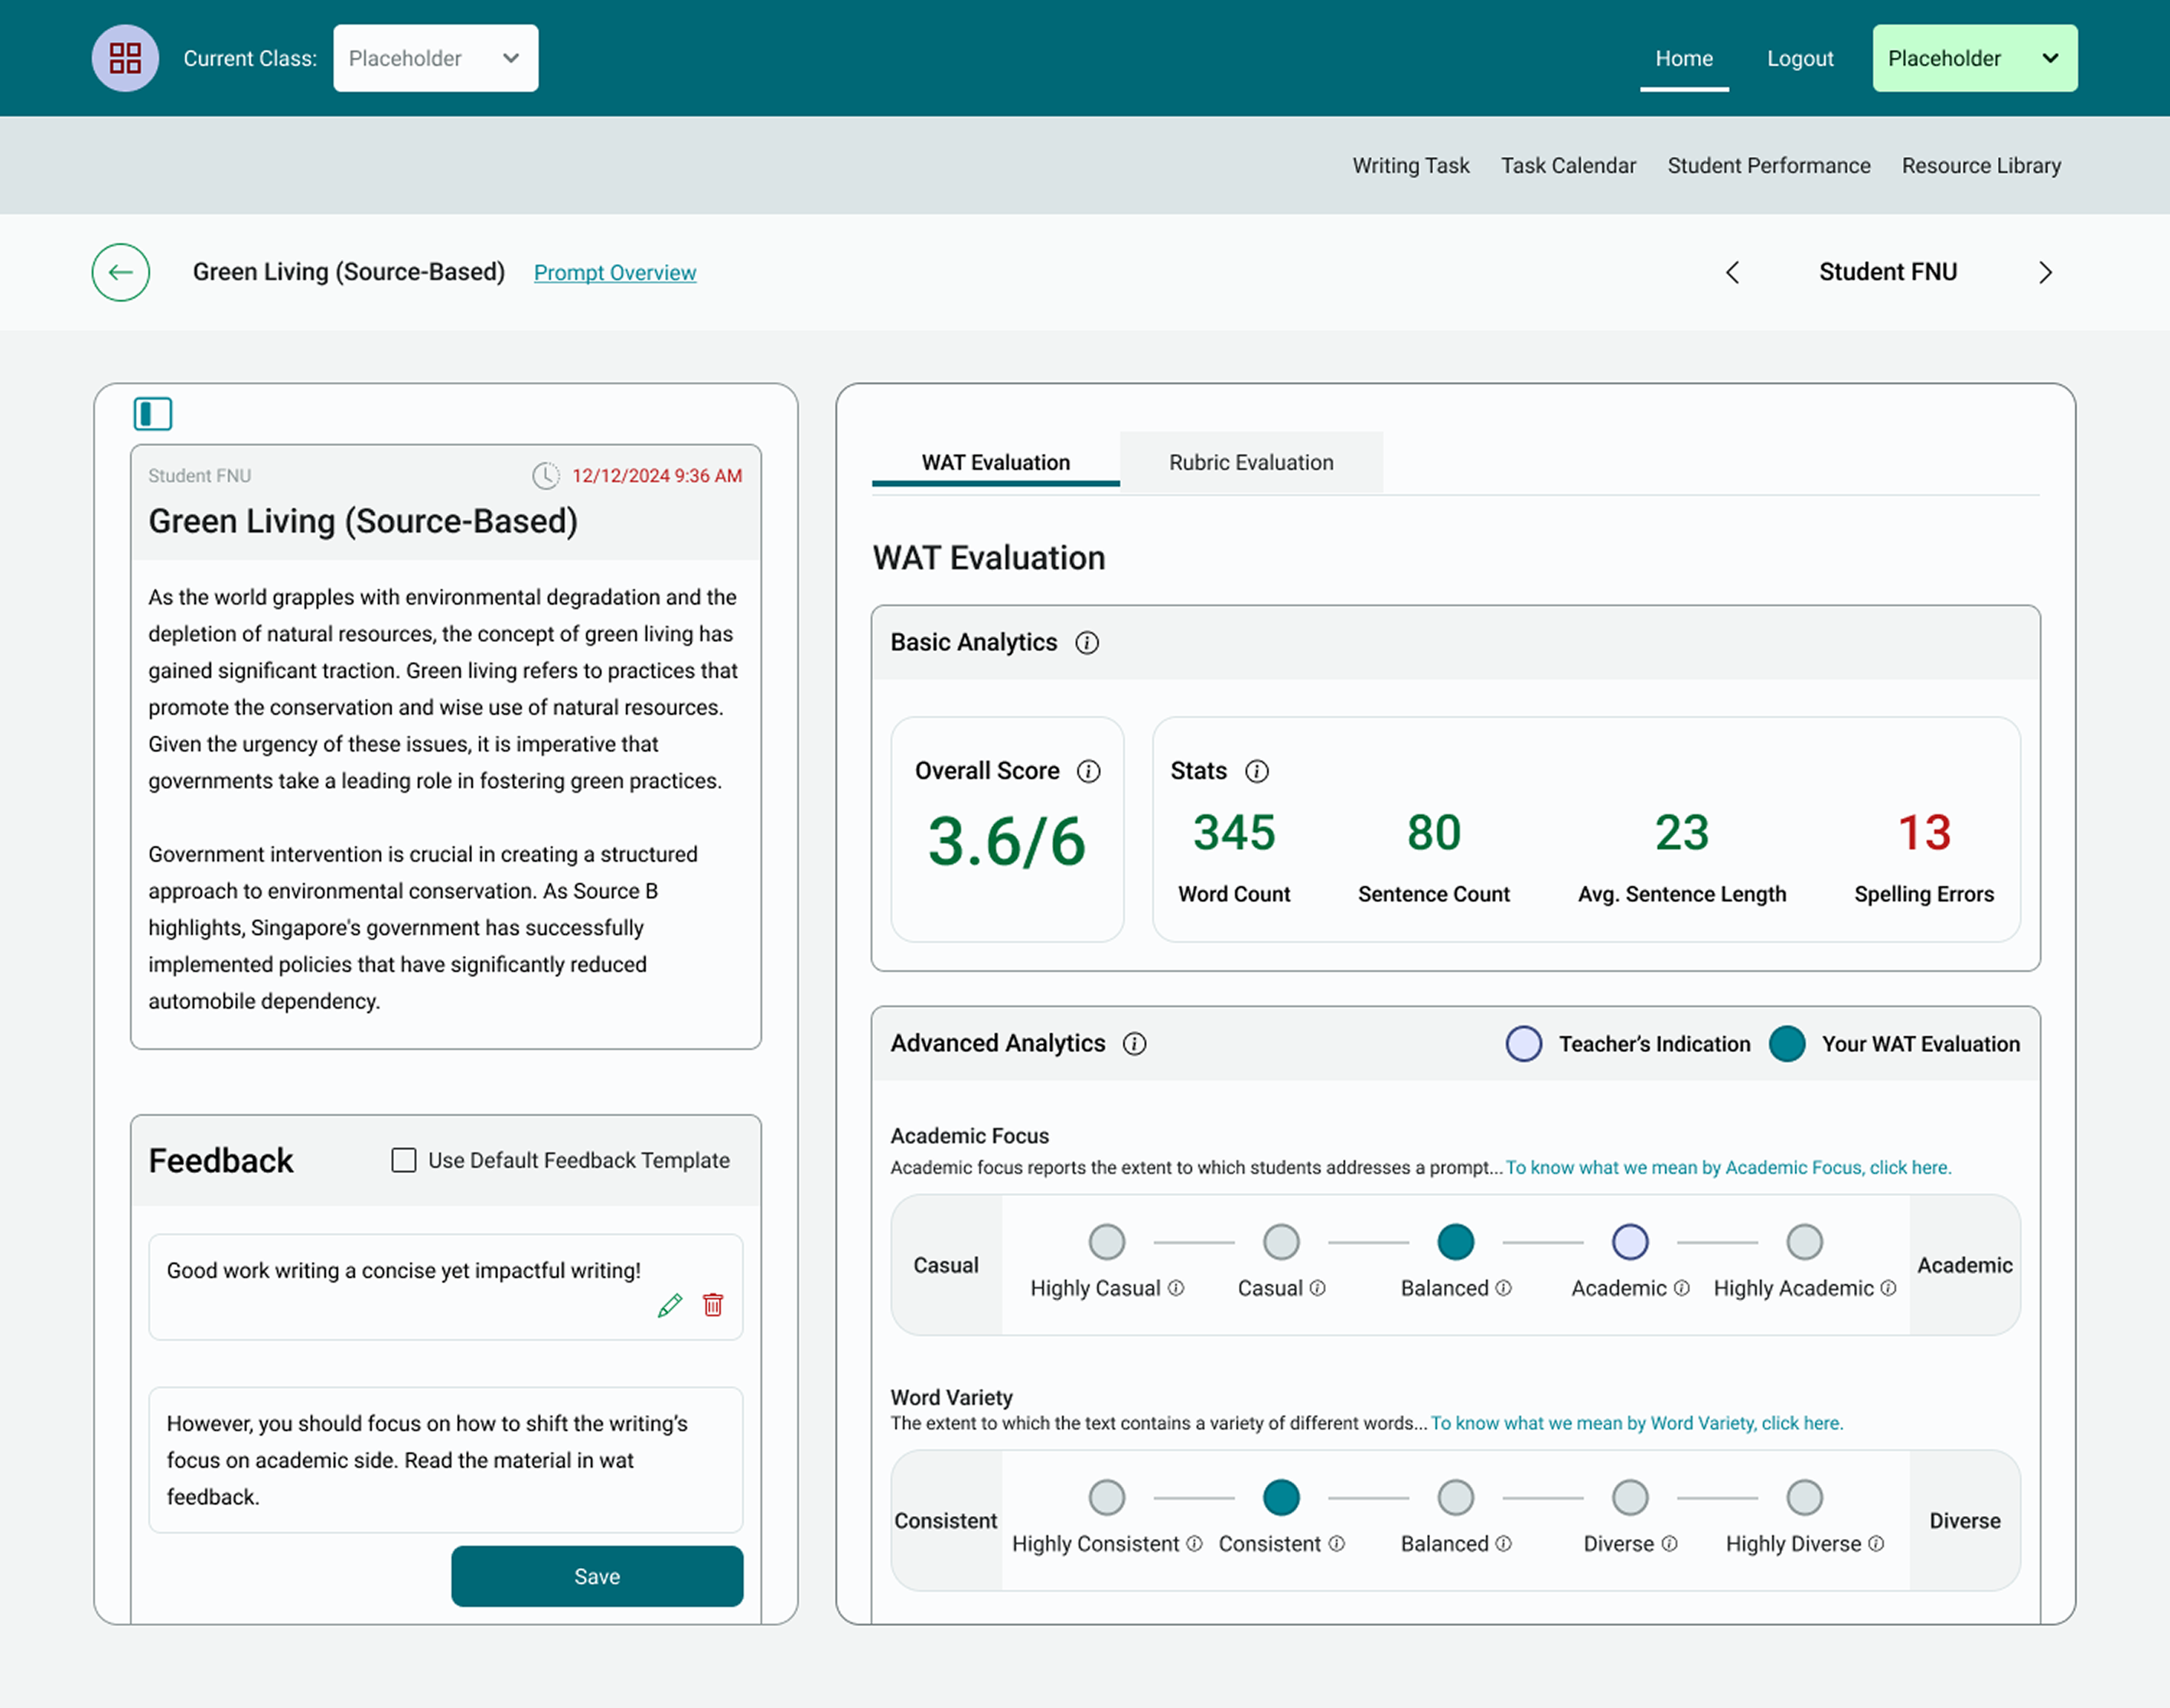
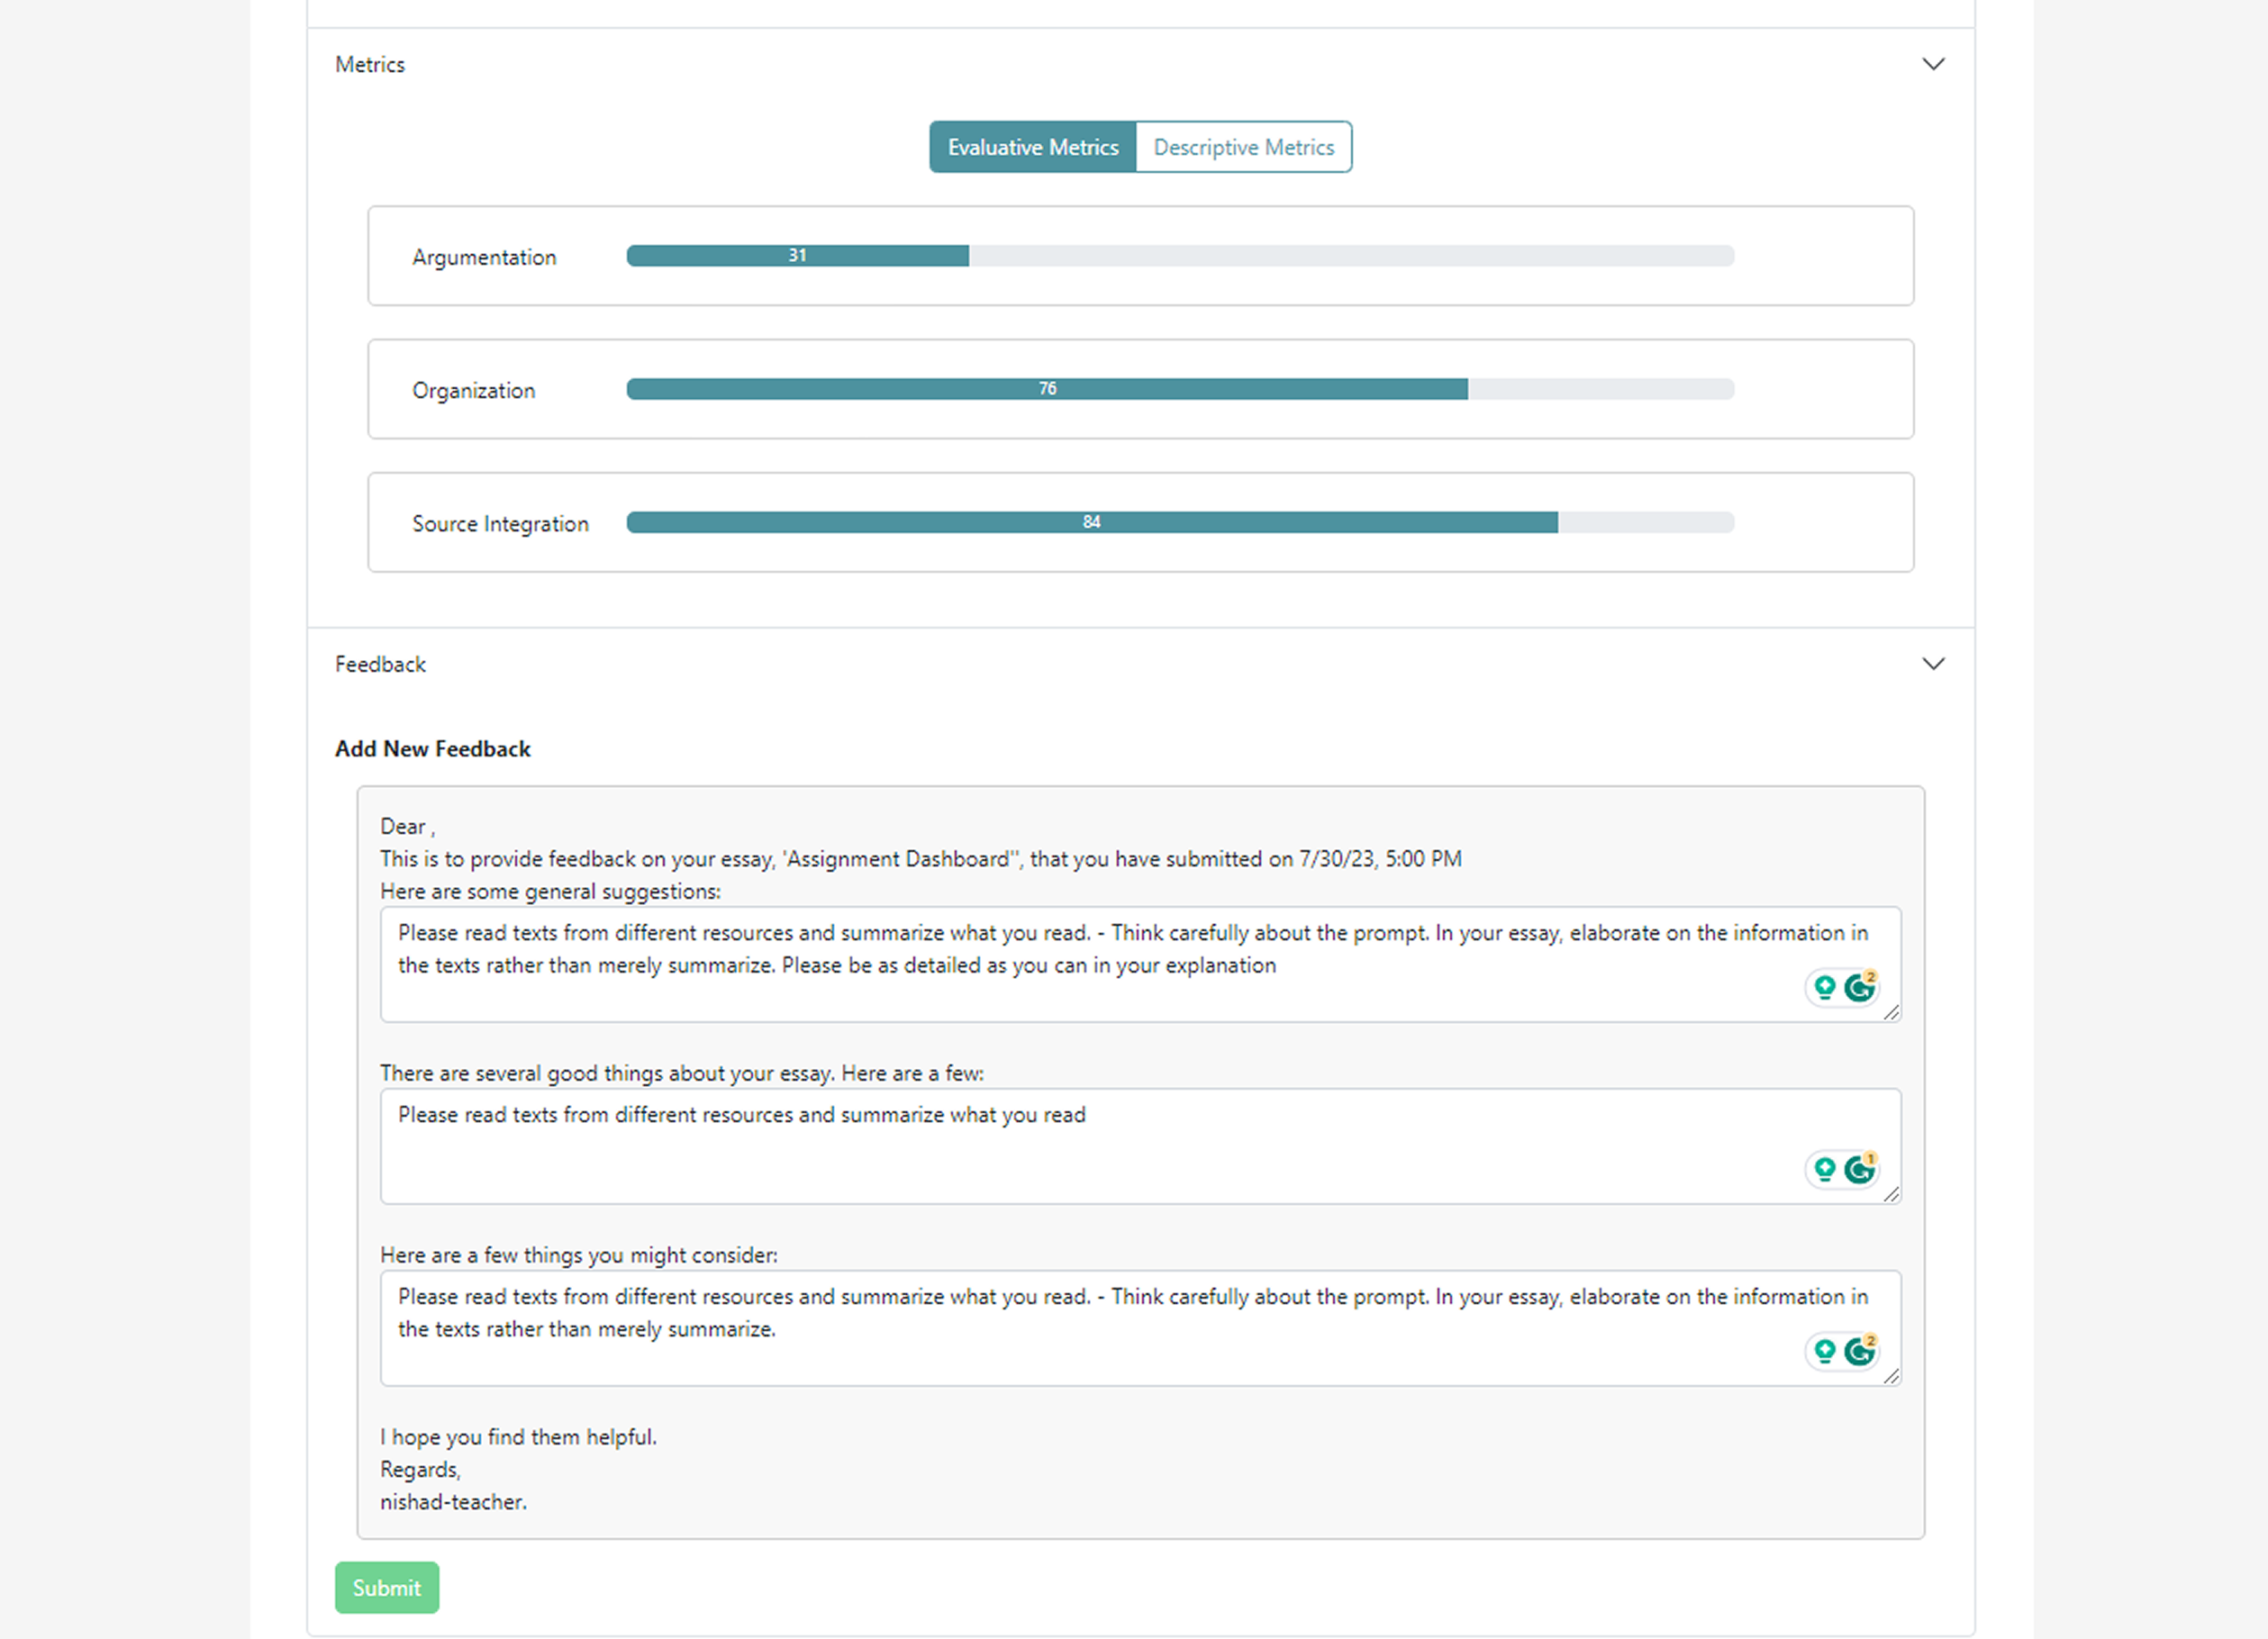
Reimagining Analytics Feedback for Clarity & Action
Challenge: Raw NLP scores were difficult to interpret and could come across as judgmental. Teachers needed quick overviews and actionable insights.
Solution Evolution:
- Initial designs used progress bar style interpretation of metric outcome (in % value).
- Post-focus group, I moved to a 2-column layout (collapsible essay view + tabs for rubric/analytics)
- I introduced spider charts for holistic metric snapshots and line graphs for progress tracking
Key Innovation: I replaced simple spectrum scores with a Likert-scale based interpretation. Teachers could indicate a desired leaning for each metric during assignment setup. Students then saw their score relative to this target, making feedback constructive rather than judgmental.
Impact: This transformed feedback from potentially confusing data points into guided, non-judgmental insights, significantly improving perceived usability and value for both teachers and students. This design was approved and moved into production.
Performance Dashboards
Key Design Decisions & Solutions
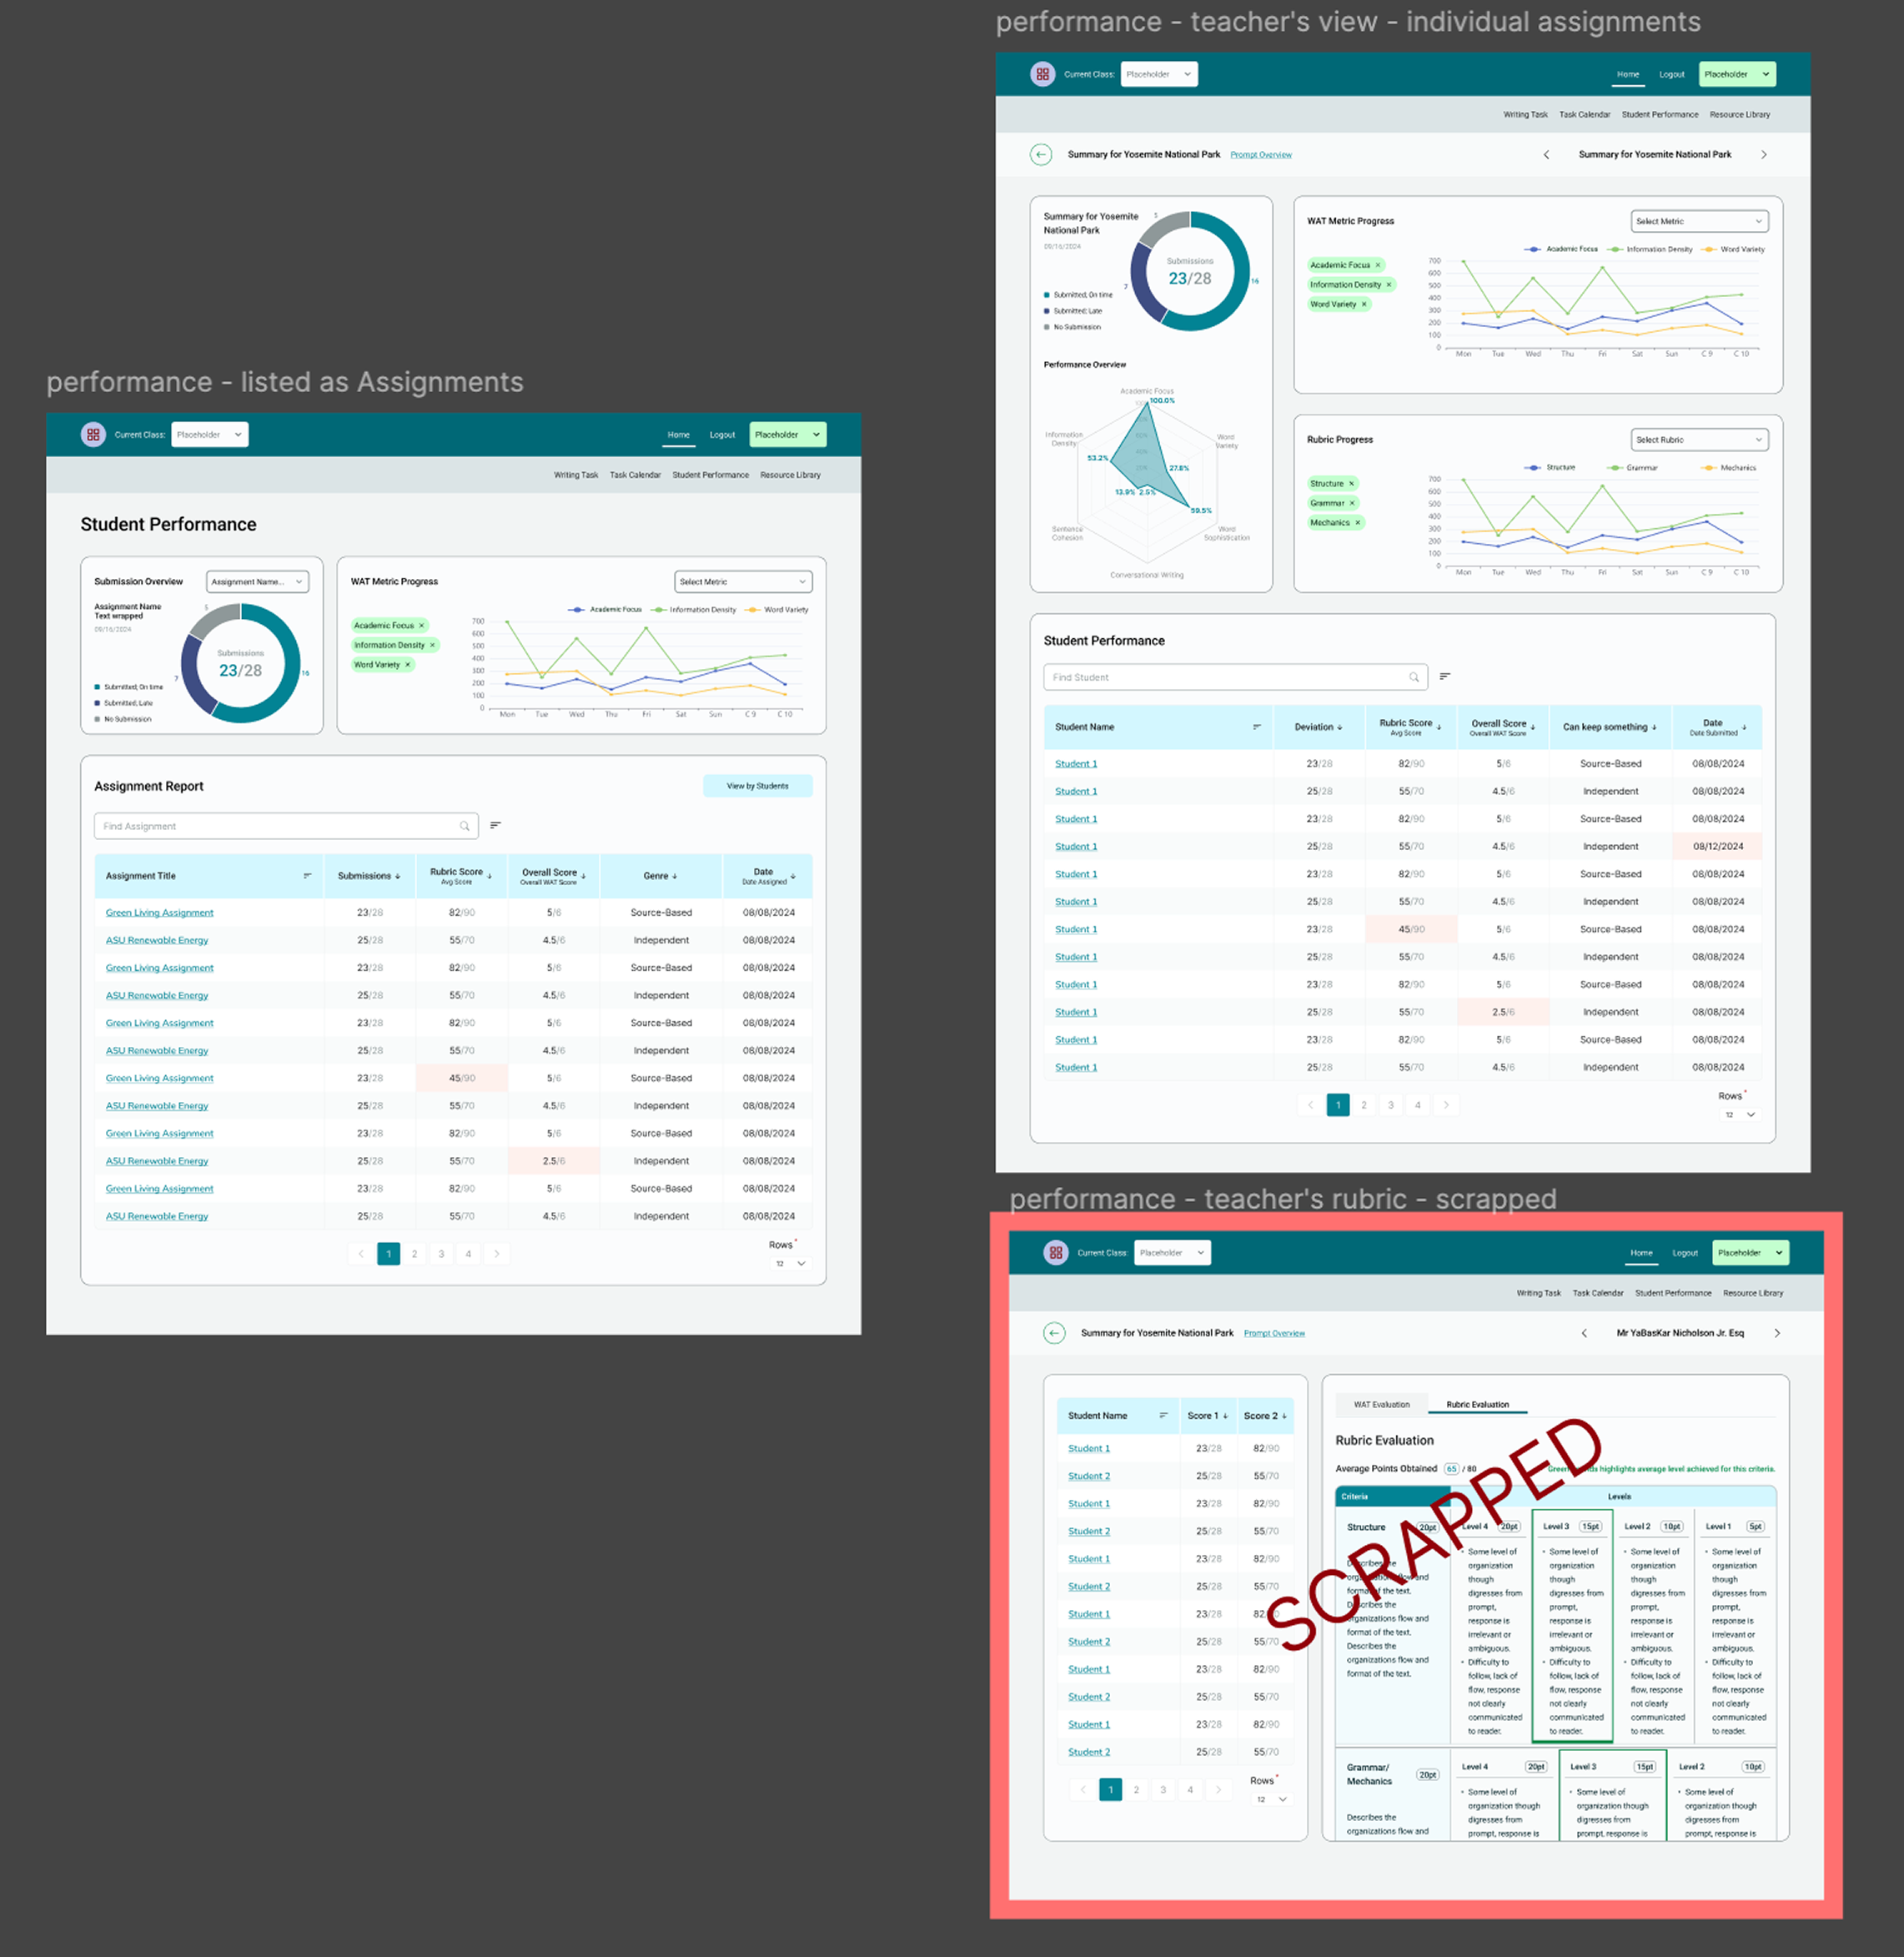
Designing Intuitive Student Performance Dashboards
Challenge: Teachers needed to track class and individual student progress effectively.
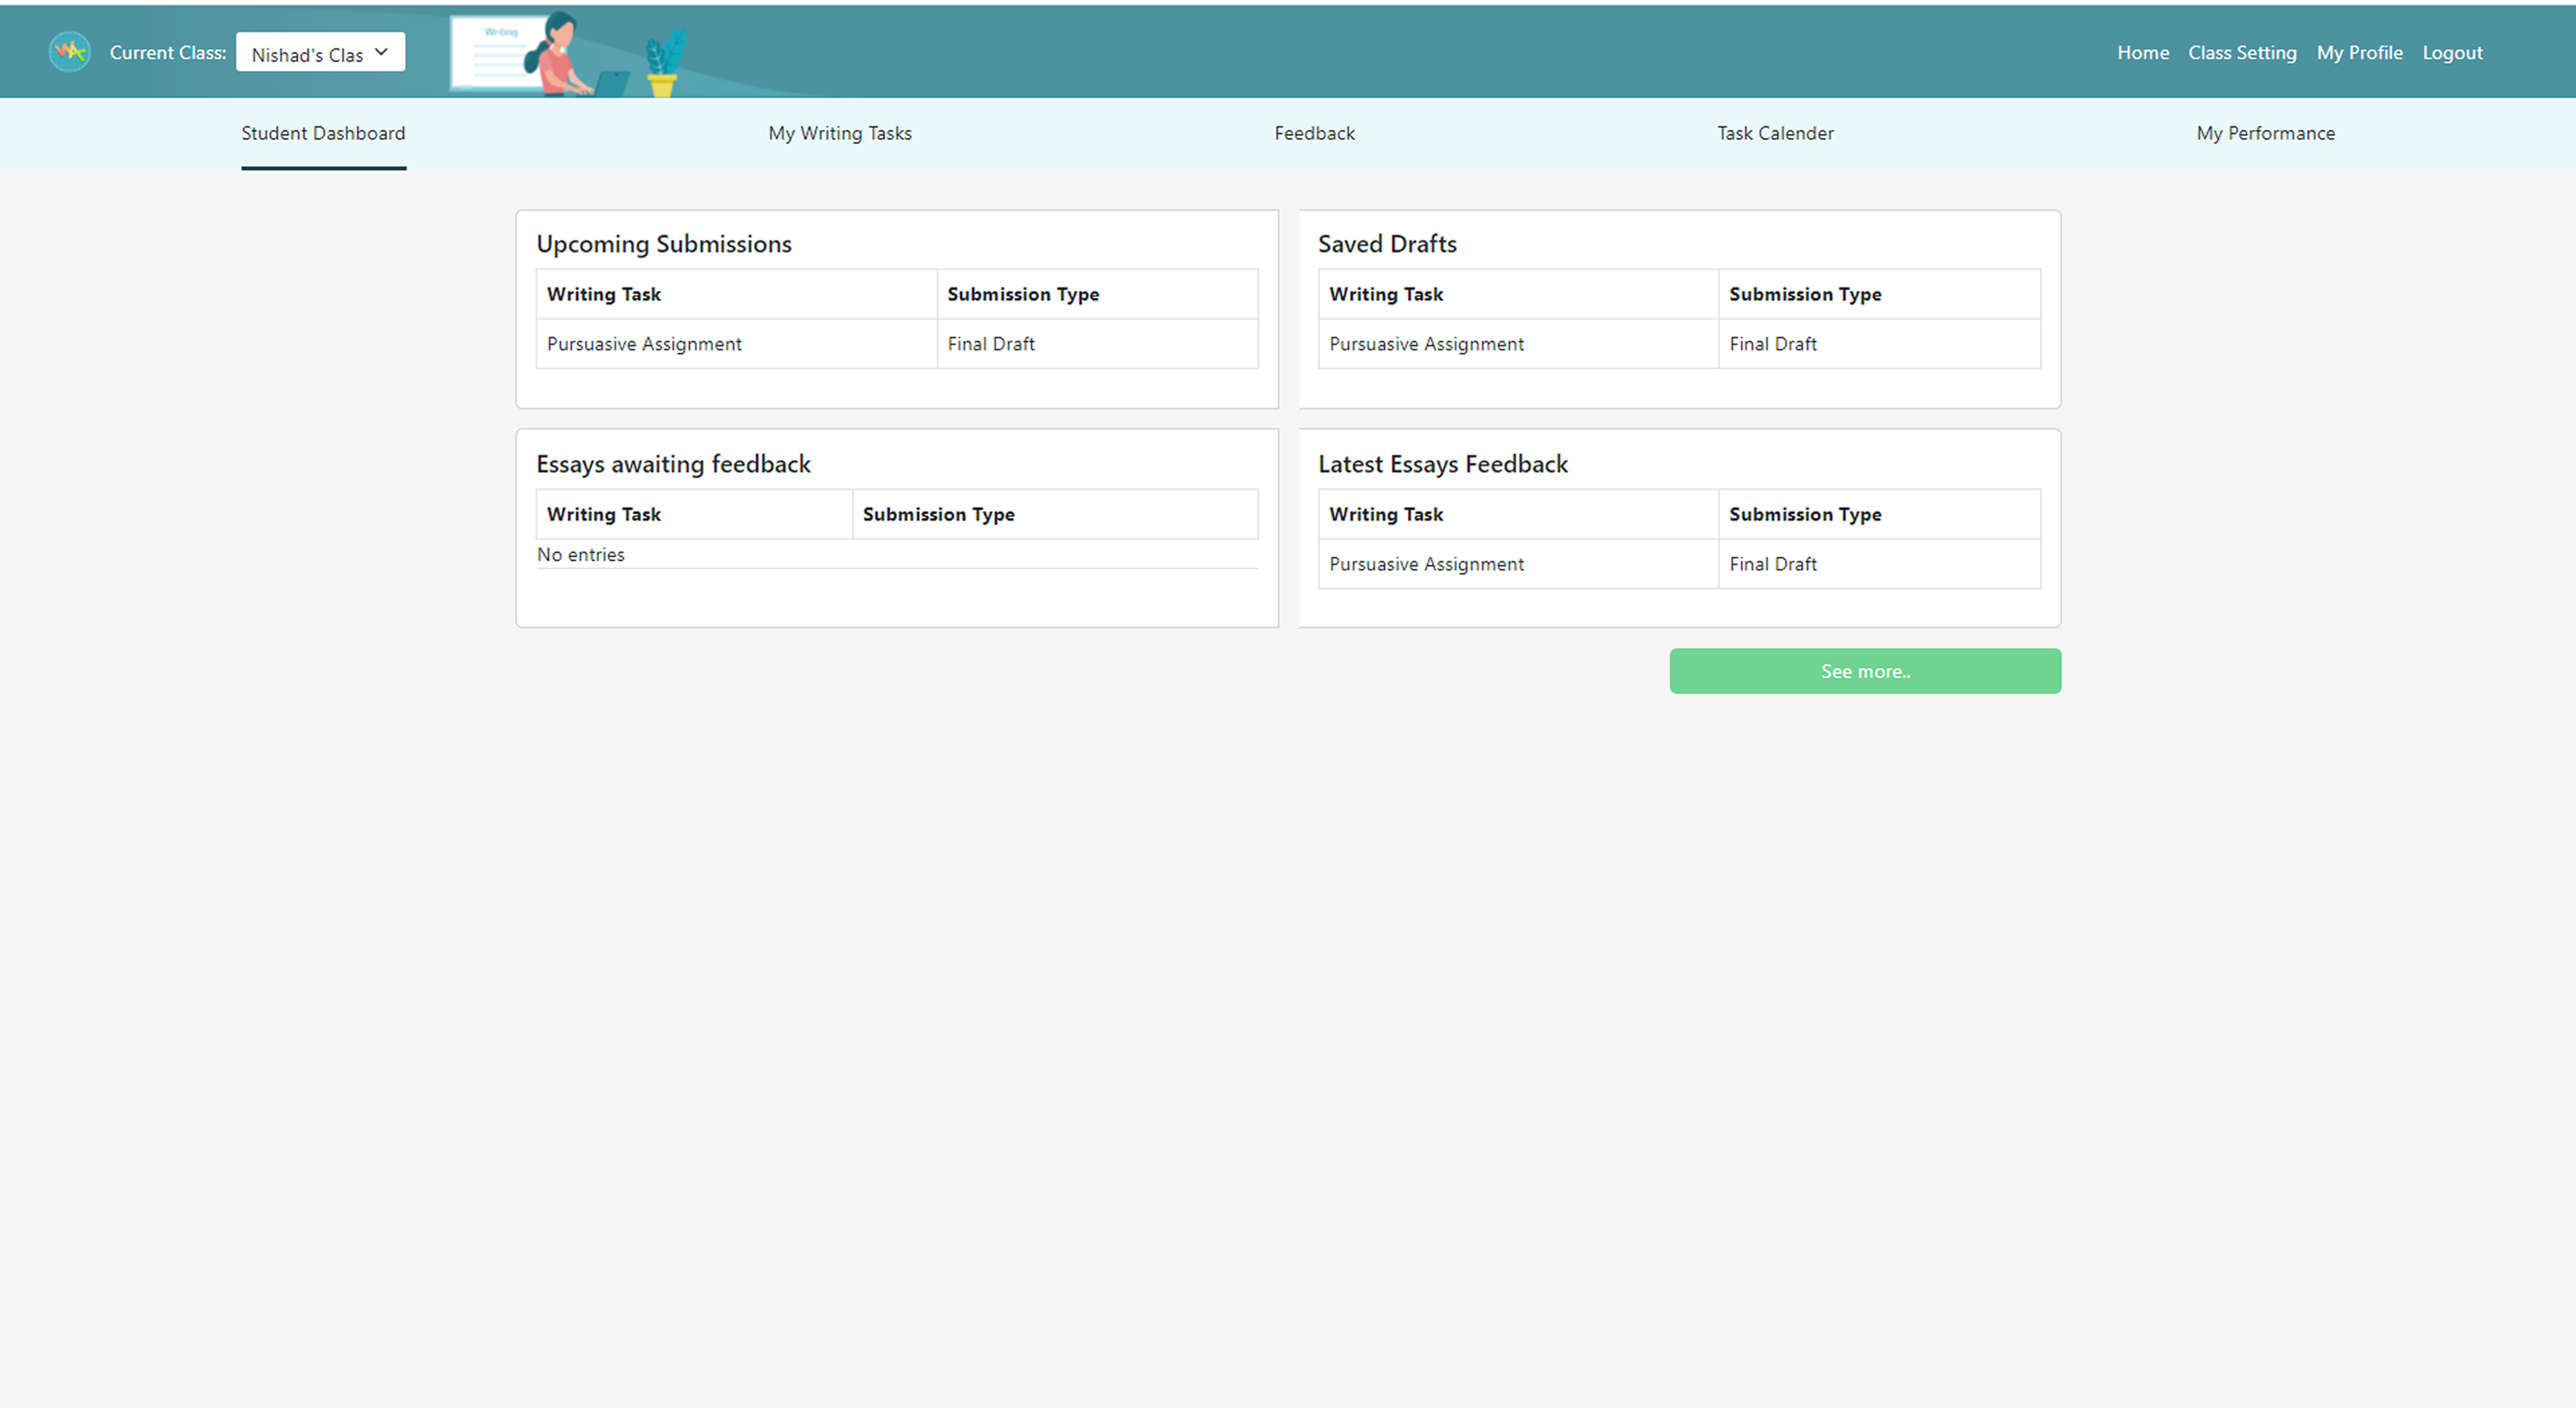
Solution: I developed tiered visualization pages:
- Class View: Overview of assignment data (line graphs, pie charts, tables)
- Assignment View: Drill-down to student-wise performance for a specific assignment
- Individual Student View: Performance across multiple assignments
- Student View: Tailored view of their own performance
Impact: This enabled efficient progress monitoring for teachers and provided students with clear insights into their development, using reusable components for development efficiency.
Impact and Outcome
Transformed Product Strategy: User research findings directly led to a strategic pivot, prioritizing features (rubric customization, feedback clarity) crucial for teacher adoption and successful beta testing.
Enhanced Usability & User Acceptance: Redesigned interfaces based on focus group feedback significantly improved the perceived usability and interpretability of complex analytics, addressing key adoption barriers.
Enabled Scalable Development: The design system I implemented became foundational for platform growth, supporting a large number of students and streamlining the software engineering cycle.
Contributed to Academic Research: Research insights and design contributions formed part of a submission to the LAK2025 & JEDM conferences, validating the academic rigor of the design process.
Improved Development Efficiency: I identified and documented 50+ critical bugs and enhancement opportunities, improving product quality and development focus.
Established Key UX Processes: I instituted a robust product discussion-to-UX design-to-development process, improving stakeholder collaboration and efficiency.
Gained Strategic Influence: My contributions led to a "seat at the table" for discussions on future strategic directions, including LMS integrations (Canvas) and AI collaborations.
Tech Stack
Design: Figma, FigJam, Interactive Prototyping, CSS Implementation (for design system)
Research: Focus Groups, Usability Testing (Internal), Qualitative Analysis (ASU Betaland AI)
Documentation & Collaboration: Airtable, Asana, Cross-functional team coordination (Engineers, Data Scientists, Researchers)
Growth
This project was pivotal in my growth as a UX professional. It demonstrates my ability to lead end-to-end UX in a complex, data-intensive domain like EdTech.
I successfully navigated the challenges of being a sole designer, balanced research rigor with practical application, and translated complex user needs into intuitive and impactful design solutions.
The experience strengthened my skills in design system architecture, user research, iterative design, and technical collaboration - all essential for roles requiring strategic design thinking and practical implementation in data-rich environments.
My progression from student worker to full-time team member with strategic input demonstrates the value and impact I delivered to the organization through this project here.